Search

Saturday, July 23, 2016

Four Highly Effective Trading Indicators Every Trader Should Know

Traders tend to overcomplicate things when they’re starting out in this exciting market. This fact is unfortunate but undeniably true. Traders often feel that a complex trading strategy with many moving parts must be better when they should focus on keeping things as simple as possible.
The Benefits of a Simple Strategy
As a trader progresses through the years, they often come to the revelation that the system with the highest level of simplicity is often best. Trading with a simple strategy allows for quick reactions and less stress. If you’re just getting started, you should seek the most effective and simple strategies for identifying trades and stick with that approach. Also, new traders would be served well by finding the common traits of FXCM’s successful Traders here.
Four Highly Effective Trading Indicators Every Trader Should Know
One way to simplify your trading is through a trading plan that includes chart indicators and a few rules as to how you should use those indicators. In keeping with the idea that simple is best, there are four easy indicators you should become familiar with using one or two at a time to identify trading entry and exit points. Once you are trading a live account a simple plan with simple rules will be your best ally.
The Tools at Your Service for Different Market Environments
Because there are many fundamental factors when determining the value of a currency relative to another currency, many traders opt to look at the charts as a simplified way to identify trading opportunities. When looking at the charts, you’ll notice two common market environments. The two environments are either ranging markets with a strong level of support and resistance, or floor and ceiling that price isn’t breaking through or a trending market where price is steadily moving higher or lower.
Using Technical Analysis allows you as a trader to identify range bound or trending environments and then find higher probability entries or exits based on their readings. Reading the indicators is as simple as putting them on the chart. Knowing how to use any one or more of the four indicators like the Moving Average, Relative Strength Index (RSI), Slow Stochastic, and Moving Average Convergence & Divergence (MACD) will provide a simple method to identify trading opportunities.
Trading With Moving Averages
Moving averages make it easier for traders to locate trading opportunities in the direction of the overall trend. When the market is trending up, you can use the moving average or multiple moving averages to identify the trend and the right time to buy or sell. The moving average is a plotted line that simply measures the average price of a currency pair over a specific period of time, like the last 200 days or year of price action to understand the overall direction.
Four Highly Effective Trading Indicators Every Trader Should Know
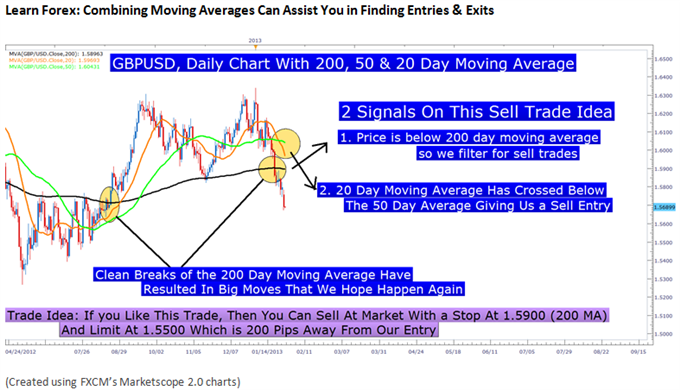
You’ll notice a trade idea was generated above only with adding a few moving averages to the chart. Identifying trade opportunities with moving averages allows you see and trade off of momentum by entering when the currency pair moves in the direction of the moving average, and exiting when it begins to move opposite.
Trading With RSI
The Relative Strength Index or RSI is an oscillator that is simple and helpful in its application. Oscillators like the RSI help you determine when a currency is overbought or oversold, so a reversal is likely. For those who like to ‘buy low and sell high’, the RSI may be the right indicator for you.
Four Highly Effective Trading Indicators Every Trader Should Know
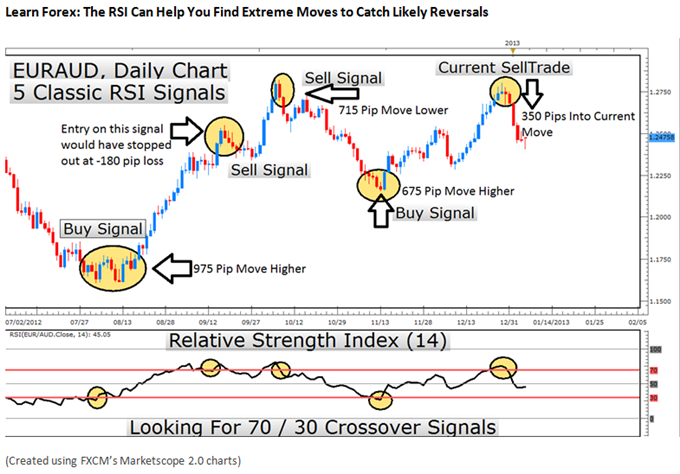
The RSI can be used equally well in trending or ranging markets to locate better entry and exit prices. When markets have no clear direction and are ranging, you can take either buy or sell signals like you see above. When markets are trending, you only want to enter in the direction of the trend when the indicator is recovering from extremes (highlighted above).
Because the RSI is an oscillator, it is plotted with values between 0 and 100. The value of 100 is considered overbought and a reversal to the downside is likely whereas the value of 0 is considered oversold and a reversal to the upside is commonplace. If an uptrend has been discovered, you would want to identify the RSI reversing from readings below 30 or oversold before entering back in the direction of the trend.
Trading With Stochastics
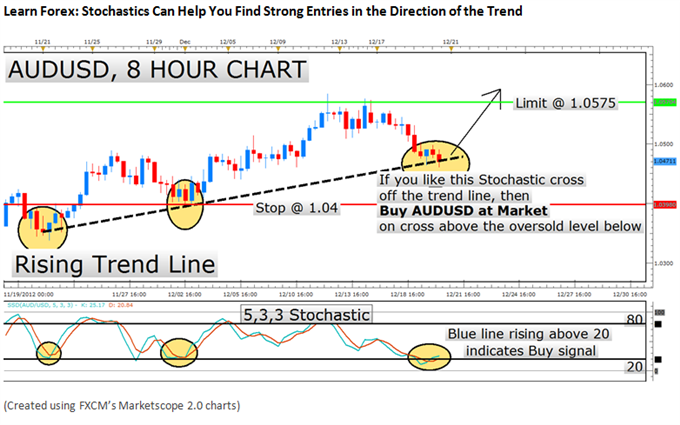
Slow Stochastics are an oscillator like the RSI that can help you locate overbought or oversold environments, likely making a reversal in price. The unique aspect of the stochastic indicator is the two lines, %K and %D line to signal our entry. Because the oscillator has the same overbought or oversold readings, you simply look for the %K line to cross above the %D line through the 20 level to identify a solid buy signal in the direction of the trend.
Four Highly Effective Trading Indicators Every Trader Should Know
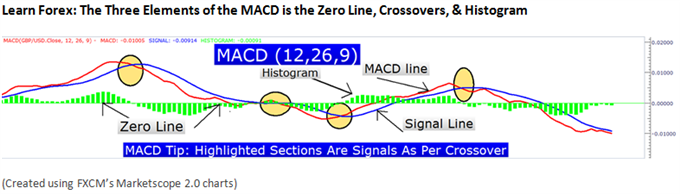
Trading With the Moving Average Convergence & Divergence (MACD)
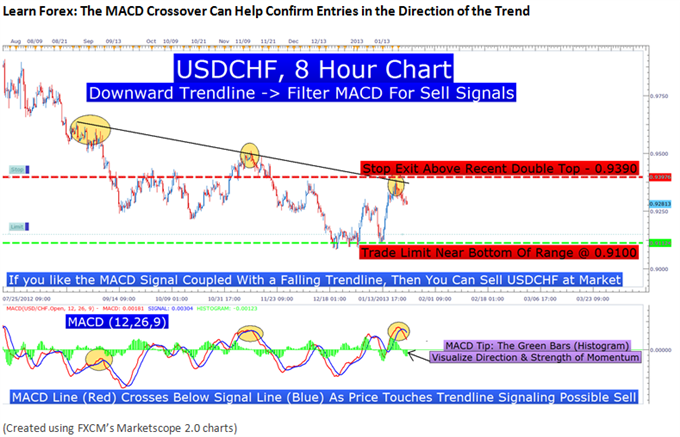
Sometimes known as the king of oscillators, the MACD can be used well in trending or ranging markets due to its use of moving averages provide a visual display of changes in momentum. After you’ve identified the market environment as either ranging or trading, there are two things you want to look for to derive signals from this indictor. First, you want to recognize the lines in relation to the zero line which identify an upward or downward bias of the currency pair. Second, you want to identify a crossover or cross under of the MACD line (Red) to the Signal line (Blue) for a buy or sell trade, respectively.
Four Highly Effective Trading Indicators Every Trader Should Know
Like all indicators, the MACD is best coupled with an identified trend or range-bound market. Once you’ve identified the trend, it is best to take crossovers of the MACD line in the direction of the trend. When you’ve entered the trade, you can set stops below the recent price extreme before the crossover, and set a trade limit at twice the amount you’re risking.
Four Highly Effective Trading Indicators Every Trader Should Know
Priceless and Free Reinforcement Training
Now that you have the knowledge of the four effective indicators, you are many steps closer to closing profitable trades. Of course, there is only opportunity and no guarantee. To help you spot daily opportunities, DailyFX has created a 4-week no-cost course via their twitter feed, @DailyFXEDU. In a few minutes a day you can follow @DailyFXEDU to see daily opportunities that align with the indicators presented today.
Of course, it’s FREE to follow and designed to be very easy to understand. If you’re building up your knowledge of trading Forex, we want to be there to assist you and your strategy development. Because the only limit to your success is your knowledge, we hope to see you there

https://www.dailyfx.com/forex/education/trading_tips/post_of_the_day/2013/02/08/Four_Highly_Effective_Trading_Indicators_Every_Trader_Should_Know.html

4 Types Of Indicators FX Traders Must Know

Many forex traders spend their time looking for that perfect moment to enter the markets or a telltale sign that screams "buy" or "sell". And while the search can be fascinating, the result is always the same. The truth is, there is no one way to trade the forex markets. As a result, successful traders must learn that there are a variety of indicators that can help to determine the best time to buy or sell a forex cross rate.
Here are four different market indicators that most successful forex traders rely upon.
Indicator No.1: A Trend-Following Tool
It is possible to make money using a countertrend approach to trading. However, for most traders the easier approach is to recognize the direction of the major trend and attempt to profit by trading in the trend's direction. This is where trend-following tools come into play. Many people misunderstand the purpose of trend-following tools and try to use them as separate trading systems. While this is possible, the real purpose of a trend-following tool is to suggest whether you should be looking to enter a long position or a short position. So let's consider one of the simplest trend-following methods – the moving average crossover.

simple moving average represents the average closing price over the number of days in question. To elaborate, let's look at two simple examples – one longer term, one shorter term. (For related information on moving averages, see Exploring The Exponentially Weighted Moving Average.)
Figure 1 displays the 50-day/200-day moving average crossover for the euro/yen cross. The theory here is that the trend is favorable when the 50-day moving average is above the 200-day average and unfavorable when the 50-day is below the 200-day. As the chart shows, this combination does a good job of identifying the major trend of the market - at least most of the time. However, no matter what moving average combination you choose to use, there will be whipsaws.
Figure 1: The euro/yen with 50-day and 200-day moving averages
Source: ProfitSource
Figure 2 shows a different combination – the 10-day/30-day crossover. The advantage of this combination is that it will react more quickly to changes in price trends than the previous pair. The disadvantage is that it will also be more susceptible to whipsaws than the longer term 50-day/200-day crossover.
Figure 2: The euro/yen with 10-day and 30-day moving averages
Source: ProfitSource
Many investors will proclaim a particular combination to be the best, but the reality is, there is no "best" moving average combination. In the end, forex traders will benefit most by deciding what combination (or combinations) fits best with their time frames. From there, the trend - as shown by these indicators - should be used to tell traders if they should trade long or trade short; it should not be relied on to time entries and exits. (For additional information, check out Forex: Should You Be Trading Trend Or Range?)
Indicator No.2: A Trend-Confirmation Tool
Now we have a trend-following tool to tell us whether the major trend of a given currency pair is up or down. But how reliable is that indicator? As mentioned earlier, trend-following tools are prone to being whipsawed. So it would be nice to have a way to gauge whether the current trend-following indicator is correct or not. For this, we will employ a trend-confirmation tool. Much like a trend-following tool, a trend-confirmation tool may or may not be intended to generate specific buy and sell signals. Instead, we are looking to see if the trend-following tool and the trend-confirmation tool agree.

In essence, if both the trend-following tool and the trend-confirmation tool are bullish, then a trader can more confidently consider taking a long trade in the currency pair in question. Likewise, if both are bearish, then the trader can focus on finding an opportunity to sell short the pair in question.
One of the most popular – and useful – trend confirmation tools is known as the moving average convergence divergence (MACD). This indicator first measures the difference between two exponentially smoothed moving averages. This difference is then smoothed and compared to a moving average of its own. When the current smoothed average is above its own moving average, then the histogram at the bottom of Figure 3 is positive and an uptrend is confirmed. On the flip side, when the current smoothed average is below its moving average, then the histogram at the bottom of Figure 3 is negative and a downtrend is confirmed. (Learn more about the MACD in A Primer On The MACD.)
Figure 3: Euro/yen cross with 50-day and 200-day moving averages and MACD indicator
Source: ProfitSource
In essence, when the trend-following moving average combination is bearish (short-term average below long-term average) and the MACD histogram is negative, then we have a confirmed downtrend. When both are positive, then we have a confirmed uptrend.
At the bottom of Figure 4 we see another trend-confirmation tool that might be considered in addition to (or in place of) MACD. It is the rate of change indicator (ROC). As displayed in Figure 4, the red line measures today's closing price divided by the closing price 28 trading days ago. Readings above 1.00 indicate that the price is higher today than it was 28 days ago and vice versa. The blue line represents a 28-day moving average of the daily ROC readings. Here, if the red line is above the blue line, then the ROC is confirming an uptrend. If the red line is below the blue line, then we have a confirmed downtrend. (For more on the ROC indicator, refer to Measure Momentum Change With ROC.)
Note in Figure 4 that the sharp price declines experienced by the euro/yen cross from mid-January to mid-February, late April through May and during the second half of August were each accompanied by:
  • The 50-day moving average below the 200-day moving average
  • A negative MACD histogram
A bearish configuration for the ROC indicator (red line below blue)
Figure 4: Euro/yen cross with MACD and rate-of-change trend confirmation indicators
Source: ProfitSource.com
Indicator No.3: An Overbought/Oversold Tool
While traders are typically well advised to trade in the direction of the major trend, one must still decide whether he or she is more comfortable jumping in as soon as a clear trend is established or after a pullback occurs. In other words, if the trend is determined to be bullish, the choice becomes whether to buy into strength or buy into weakness. If you decide to get in as quickly as possible, you can consider entering a trade as soon as an uptrend or downtrend is confirmed. On the other hand, you could wait for a pullback within the larger overall primary trend in the hope that this offers a lower risk opportunity. For this, a trader will rely on an overbought/oversold indicator.

There are many indicators that can fit this bill. However, one that is useful from a trading standpoint is the three-day relative strength index, or three-day RSI for short. This indicator calculates the cumulative sum of up days and down days over the window period and calculates a value that can range from zero to 100. If all of the price action is to the upside, the indicator will approach 100; if all of the price action is to the downside, then the indicator will approach zero. A reading of 50 is considered neutral. (More on the RSI can be found in Relative Strength Index Helps Make The Right Decisions.)
Figure 5 displays the three-day RSI for the euro/yen cross. Generally speaking, a trader looking to enter on pullbacks would consider going long if the 50-day moving average is above the 200-day and the three-day RSI drops below a certain trigger level, such as 20, which would indicate an oversold position. Conversely, the trader might consider entering a short position if the 50-day is below the 200-day and the three-day RSI rises above a certain level, such as 80, which would indicate an overbought position. Different traders may prefer using different trigger levels.
Figure 5: Euro/yen cross with three-day RSI overbought/oversold indicator
Source: ProfitSource
Indicator No.4: A Profit-Taking Tool
The last type of indicator that a forex trader needs is something to help determine when to take a profit on a winning trade. Here too, there are many choices available. In fact, the three-day RSI can also fit into this category. In other words, a trader holding a long position might consider taking some profits if the three-day RSI rises to a high level of 80 or more. Conversely, a trader holding a short position might consider taking some profit if the three-day RSI declines to a low level, such as 20 or less.

Another useful profit-taking tool is a popular indicator known as Bollinger Bands®. This tool adds and subtracts the standard deviation of price data changes over a period from the average closing price over that same time frame to create trading "bands". While many traders attempt to use Bollinger Bands® to time the entry of trades, they may be even more useful as a profit-taking tool.
Figure 6 displays the euro/yen cross with 20-day Bollinger Bands® overlaying the daily price data. A trader holding a long position might consider taking some profits if the price reaches the upper band, and a trader holding a short position might consider taking some profits if the price reaches the lower band. (Refer to The Basics Of Bollinger Bands® for more information on this tool.)
Figure 6: Euro/Yen cross with Bollinger Bands®
Source: ProfitSource
A final profit-taking tool would be a "trailing stop." Trailing stops are typically used as a method to give a trade the potential to let profits run, while also attempting to avoid losing any accumulated profit. There are many ways to arrive at a trailing stop. Figure 7 illustrates just one of these ways.
The trade shown in Figure 7 assumes that a short trade was entered in the forex market for the euro/yen on January 1, 2010. Each day the average true range over the past three trading days is multiplied by five and used to calculate a trailing stop price that can only move sideways or lower (for a short trade, or sideways or higher for a long trade).
Figure 7: Euro/yen cross with a trailing stop
The Bottom Line
If you are hesitant to get into the forex market and are waiting for an obvious entry point, you may find yourself sitting on the sidelines for a long while. By learning a variety of forex indicators, you can determine suitable strategies for choosing profitable times to back a given currency pair. Also, continued monitoring of these indicators will give strong signals that can point you toward a buy or sell signal. As with any investment, strong analysis will minimize potential risks.


Monday, December 21, 2015

Difference between Thread.start() and Thread.run() method in Java?

If you remember, a Thread is started in Java by calling the start() method of java.lang.Thread class, but if you learn more you will find out that start() method internally calls the run() method of Runnable interface to execute the code specified in the run() method in the separate thread. Now the question comes, why can't you just call the run() method instead of calling the start() method because anyway start() is calling the run()? This is one of the tricky multi-threading question you will find on Java interviews. The trick here is that, when you directly call the run() method than the code inside run() method will not be executed on a new thread, instead it will be executed on the same thread. On the other hand, when you call the Thread.start() method, then the code inside run() method will be executed on a new thread, which is actually created by the start() method. This is one of the fundamental of threading in Java, which is often get overlooked by Java developers unless you have read book like Java Threads By Scott Oaks, which explains every key multi-threading concept and thread basics in good detail.
Read more »

Sunday, December 20, 2015

How To Start Appium Node Server From Command Prompt

Earlier we learnt how to download and Install appium server In windows during THIS POST and THIS POST will show you how to launch appium from windows start menu and then how to start appium node server manually from appium Interface. It Is not compulsory to start appium software node server from Interface only to test android software app. You can start appium server from command prompt too. Bellow given steps will show you how to start appium node server from command prompt to automate android software app.

PREREQUISITE :
  1. Appium should be Installed In your windows system and environment should be configured. VIEW Appium environment configuration steps.
  2. Node JS should be Installed. View THIS POST.
Set Path System Variable Of Node JS
Earlier we Installed Node JS software. Installation will create nodejs folder at C:\Program Files\ Path. We need to set this path(C:\Program Files\nodejs followed by ;(semicolon)) as system path variable as shown In bellow Image. View THIS POST to learn more about how to open Environment variable dialog and set Path variable.


Start Appium Node Server From Command Prompt
If you look at path C:\Program Files, There will be folder for Appium software which Is created during appium Installation. We can start appium server using command prompt from this folder.
  • Navigate to C: -> Program Files -> Appium -> node_modules folder.
  • Press and hold Ctrl + Shift Keys of keyboard and press mouse right click. It will open context menu as shown bellow.

  • Select "Open command Window here" from context menu. It will open command prompt with navigation to given node_modules folder path.
  • Type command node appium In command prompt and press enter.

  • It will take some time to start appium server. When server get started, It will show you log  message like "Welcome to Appium v...etc " as shown in above Image.
  • You can press CTRL+C to stop appium server on test completion.
That means appium server Is running and we can use It to perform Android software app testing on mobile devices. This way we can start appium server from command prompt too.

<< PREVIOUS || NEXT >>

Wednesday, December 16, 2015

Appium - Capture Screenshot On Failure Or Pass In Android Test Automation

Earlier In previous post, We learnt how to capture screenshot of android mobile software app screen on any stage In android appium software automation test. Now supposing I wants to capture screenshot on test failure or I wants to capture screenshot on software test pass. In this case,  ITestListener Interface of TestNG can help us to capture screenshot on certain occurrence like test failure or software test pass.

ITestListener Interface
ITestListener Is an Interface of TestNG which can Invoke it's specific method on test failure or test pass or test skips, ect.. There are bellow given useful methods available In ITestListener Interface.
  • onFinish(ITestContext context) - Invoked after all the software tests have run.
  • onStart(ITestContext context) -  Invoked after the test class is instantiated.
  • onTestFailure(ITestResult result) - Invoked each time a test fails.
  • onTestSkipped(ITestResult result) - Invoked each time a test is skipped.
  • onTestStart(ITestResult result) -  Invoked each time before a test will be invoked.
  • onTestSuccess(ITestResult result) - Invoked each time a test succeeds.
You can view more detail on ITestListener Interface on THIS PAGE. Earlier we have used It In data driven framework. View THIS PAGE for more detail.

App To Use Capture Screenshot Test
We will use android mobile's calculator app In this software automation test example.

Aim to Achieve
We wants to capture screenshot on test pass or failure occurrence and store file in related folder. If test Is fail then capture screenshot and store It In Failures folder and If test Is pass then capture screenshot and store It In Pass folder under screenshots folder of your project as shown in bellow Image.


How To Do
We will create separate class file to write logic of capture screenshot on test fail or pass. Inside It, We will create separate method captureScreenShot to write logic to capture screenshot. We will use testng assertion to verify our software test is fail or pass and use ITestListener Interface to Invoke onTestFailure method on assertion failure and onTestSuccess on assertion pass and then call captureScreenShot method to take screenshot.

In test class file, We will write two test methods TestForFailure() and TestForPass(). Test method TestForFailure() Is written In such a way to fail It Intentionally.

Screenshot of TestForFailure() method will be stored Inside Failure folder and screenshot of TestForPass() method will be stored Inside Success folder.

Create And Run Test
I have created very simple example to demonstrate you how to capture screenshot on test failure or pass. You need to create two class files under Android package of your project as bellow.

ScreenshotUtility.java file contains logic to capture screenshot on test failure or pass.

ScreenshotUtility.java
package Android;

import java.io.File;
import java.io.IOException;
import java.text.DateFormat;
import java.text.SimpleDateFormat;
import java.util.Date;
import org.apache.commons.io.FileUtils;
import org.openqa.selenium.OutputType;
import org.openqa.selenium.TakesScreenshot;
import org.testng.ITestContext;
import org.testng.ITestListener;
import org.testng.ITestResult;

public class ScreenshotUtility implements ITestListener {
// This method will execute before starting of Test suite.
public void onStart(ITestContext tr) {

}

// This method will execute, Once the Test suite is finished.
public void onFinish(ITestContext tr) {

}

// This method will execute only when the test is pass.
public void onTestSuccess(ITestResult tr) {
captureScreenShot(tr, "pass");
}

// This method will execute only on the event of fail test.
public void onTestFailure(ITestResult tr) {
captureScreenShot(tr, "fail");
}

// This method will execute before the main test start (@Test)
public void onTestStart(ITestResult tr) {

}

// This method will execute only if any of the main test(@Test) get skipped
public void onTestSkipped(ITestResult tr) {
}

public void onTestFailedButWithinSuccessPercentage(ITestResult tr) {
}

// Function to capture screenshot.
public void captureScreenShot(ITestResult result, String status) {
// AndroidDriver driver=ScreenshotOnPassFail.getDriver();
String destDir = "";
String passfailMethod = result.getMethod().getRealClass().getSimpleName() + "." + result.getMethod().getMethodName();
// To capture screenshot.
File scrFile = ((TakesScreenshot) ScreenshotOnPassFail.driver).getScreenshotAs(OutputType.FILE);
DateFormat dateFormat = new SimpleDateFormat("dd-MMM-yyyy__hh_mm_ssaa");
// If status = fail then set folder name "screenshots/Failures"
if (status.equalsIgnoreCase("fail")) {
destDir = "screenshots/Failures";
}
// If status = pass then set folder name "screenshots/Success"
else if (status.equalsIgnoreCase("pass")) {
destDir = "screenshots/Success";
}

// To create folder to store screenshots
new File(destDir).mkdirs();
// Set file name with combination of test class name + date time.
String destFile = passfailMethod + " - " + dateFormat.format(new Date()) + ".png";

try {
// Store file at destination folder location
FileUtils.copyFile(scrFile, new File(destDir + "/" + destFile));
} catch (IOException e) {
e.printStackTrace();
}
}
}


ScreenshotOnPassFail.java file contain android cal app test. If you see In bellow given test, We have used @Listeners annotation. It mansion that testng listeners are Implemented In ScreenshotUtility class file to listen.

ScreenshotOnPassFail.java
package Android;

import java.io.IOException;
import java.net.MalformedURLException;
import java.net.URL;
import java.util.concurrent.TimeUnit;
import io.appium.java_client.android.AndroidDriver;
import org.openqa.selenium.By;
import org.openqa.selenium.WebElement;
import org.openqa.selenium.remote.DesiredCapabilities;
import org.testng.annotations.AfterClass;
import org.testng.annotations.BeforeClass;
import org.testng.annotations.Listeners;
import org.testng.annotations.Test;

@Listeners({ ScreenshotUtility.class })
public class ScreenshotOnPassFail {
static AndroidDriver driver;

@BeforeClass
public void initialize() throws MalformedURLException {
DesiredCapabilities capabilities = new DesiredCapabilities();
capabilities.setCapability("deviceName", "ZX1B32FFXF");
capabilities.setCapability("browserName", "Android");
capabilities.setCapability("platformVersion", "4.4.2");
capabilities.setCapability("platformName", "Android");
capabilities.setCapability("appPackage", "com.android.calculator2");
capabilities.setCapability("appActivity", "com.android.calculator2.Calculator");
driver = new AndroidDriver(new URL("http://127.0.0.1:4723/wd/hub"), capabilities);
driver.manage().timeouts().implicitlyWait(5, TimeUnit.SECONDS);
}

// Method Is written In such a way to fail It Intentionally.
// This method will fail as actual result 6 will not match with expected 7.

@Test
public void TestForFailure() throws IOException {
// Click on DELETE/CLR button to clear result text box before running test.
((WebElement) driver.findElements(By.xpath("//android.widget.Button")).get(0)).click();
// Click on 2, +, 4 and = buttons.
driver.findElement(By.name("2")).click();
driver.findElement(By.name("+")).click();
driver.findElement(By.name("4")).click();
driver.findElement(By.name("=")).click();
// Get result from calc result textbox.
String result = driver.findElement(By.className("android.widget.EditText")).getText();
// Compare actual and expected result using testng assertion and mark test pass or fail based on result.
// Assertion will fail. So It will call onTestFailure method from ScreenshotUtility.

assert result.equals("7") : "Expected value : 7 did not match with Actual value: "+ result;
}

@Test
public void TestForPass() throws IOException {
// Click on DELETE/CLR button to clear result text box before running test.
((WebElement) driver.findElements(By.xpath("//android.widget.Button")).get(0)).click();
// Click on 3, +, 4 and = buttons.
driver.findElement(By.name("3")).click();
driver.findElement(By.name("+")).click();
driver.findElement(By.name("4")).click();
driver.findElement(By.name("=")).click();
// Get result from calc result textbox.
String result = driver.findElement(By.className("android.widget.EditText")).getText();
// Compare actual and expected result using testng assertion and mark test pass or fail based on result.
// Assertion will pass. So It will call onTestSuccess method from ScreenshotUtility.

assert result.equals("7") : "Expected value : 7 did not match with Actual value: " + result;
}

@AfterClass
public void End() {
driver.quit();
}
}

Connect your device with PC and run above ScreenshotOnPassFail test using testng and appium.
  • TestForFailure() method : Here assertion will fail so onTestFailure method will be called from ScreenshotUtility.java. It will capture screenshot and store It in Failures folder under screenshots folder.
  • TestForPass() method : Here assertion will pass so onTestSuccess method will be called from ScreenshotUtility.java. It will capture screenshot and store It in Success folder under screenshots folder.
This Is the way to capture screenshot on failure or pass of any android appium software automation test.

Tuesday, December 15, 2015

Top 3 Free Struts Books for Java EE developers - Learn Online, PDF download

Jakarta Struts is one of the most popular MVC frameworks to create a Java web application. Struts 1.0 had ruled the world in early 2000 era before Spring MVC took over. Still there are lots of projects written in Struts which needs active maintenance and that's why Struts developers are still in demand. It has not become anything like COBOL, but the latest version of Struts 2.0 is a capable web MVC framework with dependency injection and has a sizable community behind it. It has close competition with Spring MVC but given the demand for Struts developer, it's still a good technology to learn if you are looking for the job in Java web development position. What is the best way to learn Struts? Well, you can start with books and who doesn't like free eBooks and I am going to share some of the good free Ebooks to learn Struts, useful for both Java and J2EE developers.
Read more »

Sunday, December 13, 2015

Appium - Capture Screenshot Android App Mobile Screen

Capturing screenshot in appium android automation Is main requirement for any software automation tool. During software automation testing process, It should allow you to capture screenshot automatically to show bug or some design Issue to development/design team. For android software application automation testing using appium, We can use TakesScreenshot Interface of WebDriver to capture screenshot of android app screen. I have prepared simple example on how to capture screenshot In android appium automation software test using TakesScreenshot Interface of WebDriver.

App To Use Capture Screenshot Test
We will use API Demos android software app for Capture Screenshot test. You can download it from HERE.

Aim to Achieve In Capture Screenshot Test
We wants to capture screenshot of android mobile screen on some stage of appium automation test. And then we will store It Inside screenshots folder under project. We will prepare file name using current date time programmatically as shown In bellow Image.


Above Image shows screenshot which Is taken during android appium automation test.

Create And Run Capture Screenshot Test
Create new file CaptureScreenShot.java file under your Android package of your project and write bellow given test script In It.

package Android;

import io.appium.java_client.android.AndroidDriver;

import java.io.File;
import java.io.IOException;
import java.net.URL;
import java.text.DateFormat;
import java.text.SimpleDateFormat;
import java.util.Date;
import java.util.concurrent.TimeUnit;
import org.apache.commons.io.FileUtils;
import org.openqa.selenium.By;
import org.openqa.selenium.Dimension;
import org.openqa.selenium.OutputType;
import org.openqa.selenium.TakesScreenshot;
import org.openqa.selenium.remote.DesiredCapabilities;
import org.testng.annotations.AfterTest;
import org.testng.annotations.BeforeTest;
import org.testng.annotations.Test;

public class CaptureScreenShot {
AndroidDriver driver;
Dimension size;
String destDir;
DateFormat dateFormat;

@BeforeTest
public void setUp() throws Exception {
DesiredCapabilities capabilities = new DesiredCapabilities();
capabilities.setCapability("deviceName", "ZX1B32FFXF");
capabilities.setCapability("browserName", "Android");
capabilities.setCapability("platformVersion", "4.4.2");
capabilities.setCapability("platformName", "Android");
capabilities.setCapability("appPackage", "io.appium.android.apis");
capabilities.setCapability("appActivity", "io.appium.android.apis.ApiDemos");
driver = new AndroidDriver(new URL("http://127.0.0.1:4723/wd/hub"), capabilities);
driver.manage().timeouts().implicitlyWait(15, TimeUnit.SECONDS);
}

@Test
public void ScrollToTab() {
// Scroll till element which contains "Views" text If It Is not visible on screen.
driver.scrollTo("Views");
// Click on Views.
driver.findElement(By.name("Views")).click();
// Scroll till element which contains "Tabs" text If It Is not visible on screen.
driver.scrollTo("Tabs");
//Call takeScreenShot() function to capture screenshot of android screen.
takeScreenShot();

}

public void takeScreenShot() {
// Set folder name to store screenshots.
destDir = "screenshots";
// Capture screenshot.
File scrFile = ((TakesScreenshot) driver).getScreenshotAs(OutputType.FILE);
// Set date format to set It as screenshot file name.
dateFormat = new SimpleDateFormat("dd-MMM-yyyy__hh_mm_ssaa");
// Create folder under project with name "screenshots" provided to destDir.
new File(destDir).mkdirs();
// Set file name using current date time.
String destFile = dateFormat.format(new Date()) + ".png";

try {
// Copy paste file at destination folder location
FileUtils.copyFile(scrFile, new File(destDir + "/" + destFile));
} catch (IOException e) {
e.printStackTrace();
}
}

@AfterTest
public void End() {
driver.quit();
}
}

Test Description
Above android appium software test will navigate to Views screen and scroll down till Tabs text on API Demos android app. Then It will call takeScreenShot(); method to capture and store android app screenshot. takeScreenShot() method will,
  • Capture screenshot using TakesScreenshot Interface of webdriver.
  • Get current date and time and store It in variable.
  • Create new folder with name "screenshots" under your project.
  • Set file name using current date and time.
  • Store file In "screenshots" folder.
When you run above test, It will create screenshots folder under your project and store screenshot file In It. Refresh your project folder after test execution to see new created folder and screenshot file.

This way you can capture and store screenshot of any android app.